Today I went to the Five Good Ideas (http://maytree.com/training/fivegoodideas) session* on Open Data, with speaker Harvey Low, who is Manager, Social Research & Analysis Unit, Toronto Social Development Finance & Administration with the City of Toronto. I have capital-O Opinions about data, transparency, and the differences between data, information, and knowledge (or wisdom), so I was particularly interested to hear Mr Low’s ideas.
His five good ideas:
1. Data is not just for geeks.
Everyone in the nonprofit sector needs to think about how they’re using data to make decisions.
2. You don’t realize what you have.
Turning data into information (and then into knowledge) is a different issue, but think about what you might have that could help. Can you demonstrate the extent of a problem? Do you have any data that others might not? How could you share it? How can we make sure data is captured and released consistently so it can be compared over time?
3. Bridge the data-policy divide.
“We’re not good at linking data to social issues,” says Low. Do you have anything that could link Problem A with Potential Policy B? Does anyone? Data is key to evidence-based planning (which Toronto has, he says, embraced). But not just any data — it’s about releasing RELEVANT data that can be used to help solve problems.
4. Technology can be a friend.
Sometimes we need to think out of the box — for example, how can we apply AODA accessibility principles to spatial interpretation of information (maps) — but technology lets us share, combine and recombine information in new ways.
5. Walk the talk (make open data real).
You get more leverage and value if you share what you have (minding privacy and legal issues appropriately). Data goes out; hopefully wisdom circles back.
He shared a number of excellent resources which are now posted on Maytree’s website (http://maytree.com/fgi/five-good-ideas-use-share-contribute-open-data.html). Several others arose during the discussion:
1. The Mowat Centre’s An Open Future: Data priorities for the not-for-profit sector http://mowatcentre.ca/an-open-future/
2. Datalibre.ca: urging governments to make data about Canada and Canadians free and accessible to citizens http://datalibre.ca/
There was mention of the Toronto Cycling app, which several of us in the Health Nexus office use to give the city our data about where we cycle. That data will be used to help create cycling infrastructure, but people may find other interesting uses for it as well.
Coincidentally, an article on open data examples from cities in the USA was waiting for me back at the office (http://www.citylab.com/cityfixer/2015/04/3-cities-using-open-data-in-cre…).
The group discussion raised a few sticky issues.
1. Lack of a good venue for nonprofits to share data.
More and more it is clear that this is a niche that’s nearly empty at the moment. Where would YOU share your data? The Toronto Foundation (https://torontofoundation.ca/), which works with the City of Toronto to release data relevant to the social determinants of health, kindly offered its services and encouraged anyone who would like to share their data with the city to give them a call. Outside Toronto, however, and at regional/provincial/federal levels, it’s a difficult question.
2. The potential privatisation of personal information.
As we’ve seen, large companies are inclined to take liberties with people’s information. Releasing open data could add to this trend if it isn’t considered carefully.
3. Conflicts between data and ideology
You can pick and choose data to support a predefined conclusion to support your policy, but if it’s open data someone else can show what you have done. Some governments aren’t fond of this idea.
The discussion concluded with Low’s firm belief that data is a human right, and that we need to advocate for the return of the long-form census. I have to agree: to make Canada as good a place to live as we can, people must be able to draw their own conclusions about the evidence for policies and about the effects policies might have — and for that we need open data.
—
* If you’re not familiar with Maytree’s Five Good Ideas series, I encourage you to check it out. You can attend sessions in person in downtown Toronto or via livestream. Recordings are posted quickly after the session. Sessions are typically a half-hour presentation (with lunch, for onsite attendees), half an hour of discussion with others at your table (there is a facilitated discussion for online attendees as well), then half an hour of discussion with the whole group.
Comments closed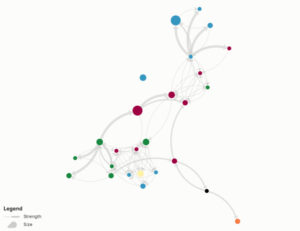 Network mapping helps you to visualize referral patterns